
Contents
1. What is TGS 10?
2. Accessing the Reporting tool
3. TGS 10 Dashboard
4. Types of reports
5. Generating a report
1. What is TGS 10?
Celiveo Track-GreenSaver (TGS) 10 is an independent reporting tool of Celiveo that helps create detailed reports from the data collected from printer and MFP usage. These reports make it possible to monitor printing costs and influence user behavior. Detailed web-based reports help to identify sources of waste and fine-tune the printing environment to reduce costs and prevent misuse. You can also use the recorded data to forecast costs allowing you to better plan your budget.
Reports are created based on the following data collected:
- Network data collected includes: user name, workstation name, server name, printer name, and printer group.
- Print job data collected includes: time/date printed, document title, document type, page count, sheet count, copy count, page size, print job size, black and white output, color output, duplex, etc.
2. Accessing TGS 10
- Double-click the Celiveo Reporting tool icon on the desktop. The initial logon screen of the Reporting tool displays.
![]()
- Specify admin as both the [User Name] and [Password].
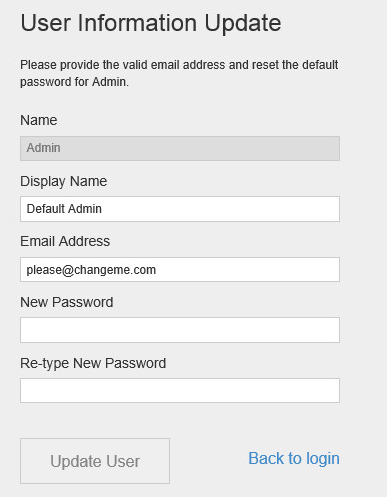
- Click [Login]. The User Information Update screen displays.
![]()
- At [Email Address], specify a valid email address.
- Specify a new password for the Default Admin user account.
- Click [Update User].

3. TGS 10 Dashboard
3.1 Settings
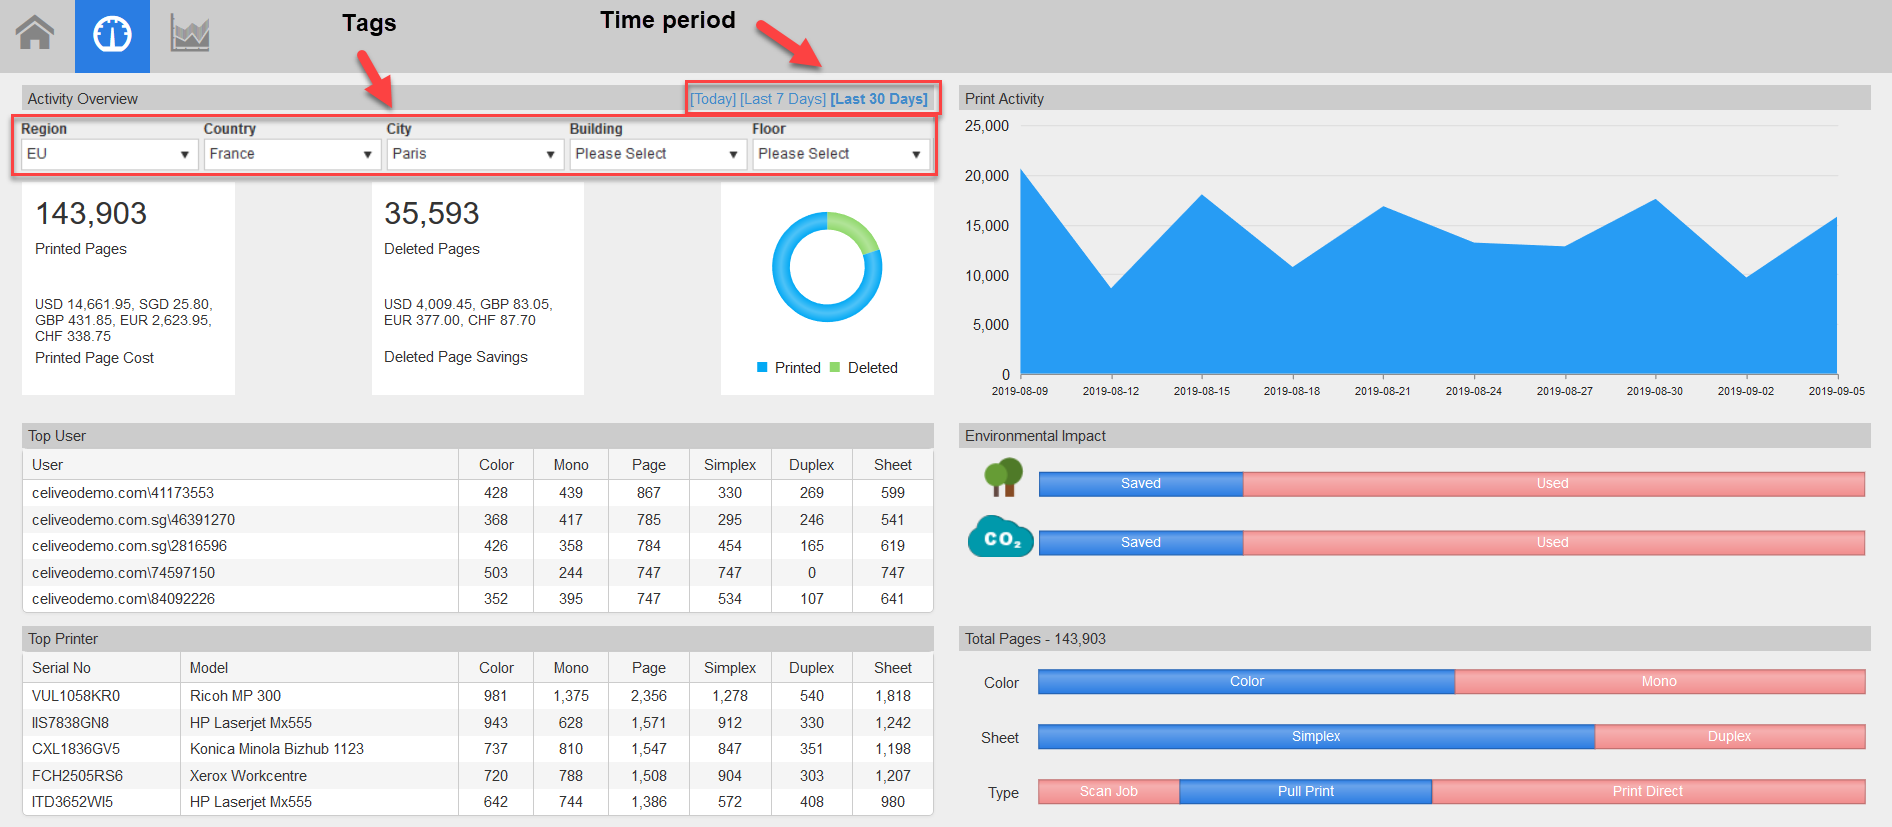
You can define the time period of your dashboard: you can choose to see the activity of the day, the last 7 days or the last 30 days by clicking the buttons located at the top of the Overview section.
You can also choose to use tags to see data based on tag combinations.
3.2 Information provided
3.2.1 Activity Overview
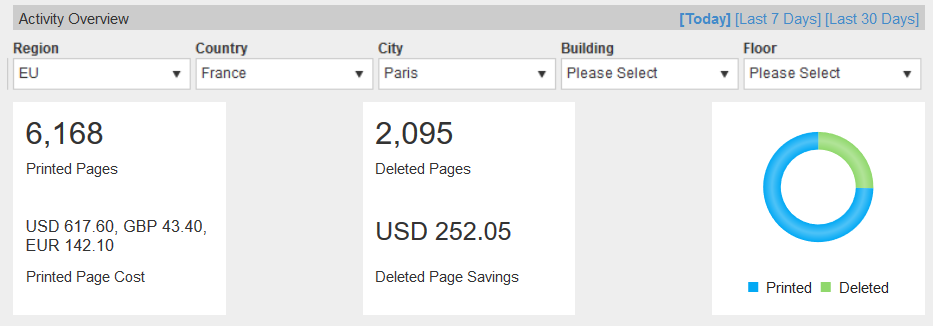
This section details the number of pages that have been printed and deleted on the time period and geographical area you defined. It also indicates the cost of all printed pages and the savings allowed by deleted pages in different currencies.
3.2.2 Top User
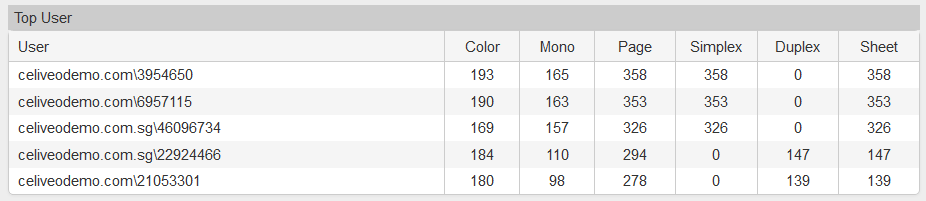
This section provides printer usage information about the most active users on the time period and geographical area you defined.
3.2.3 Top Printer
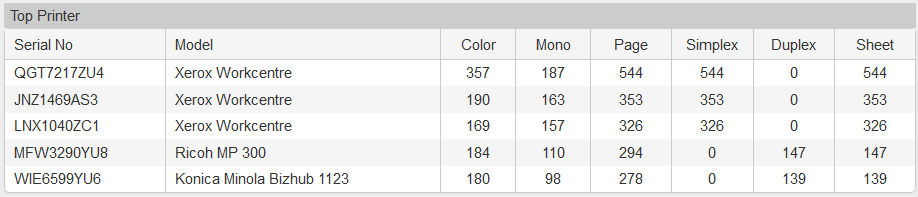
This section provides usage information about the most active printers on the time period and geographical area you defined.
3.2.4 Print Activity
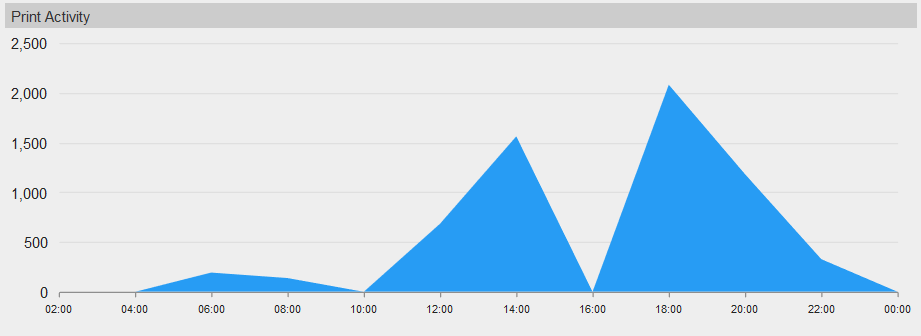
This section provides a chart indicating the number of printing pages over the time period and geographical area you defined.
3.2.5 Environmental Impact
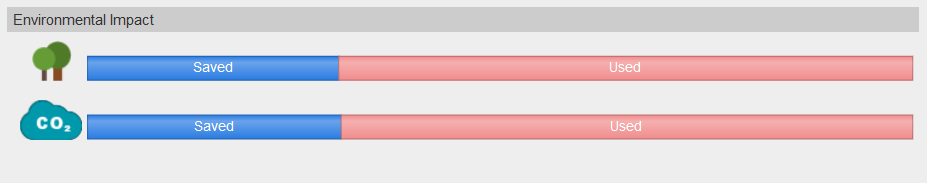
This section provides a diagram indicating the number of trees saved or used and the amount of CO2 saved or used over the time period and the geographical area you defined.
3.2.6 Total Pages
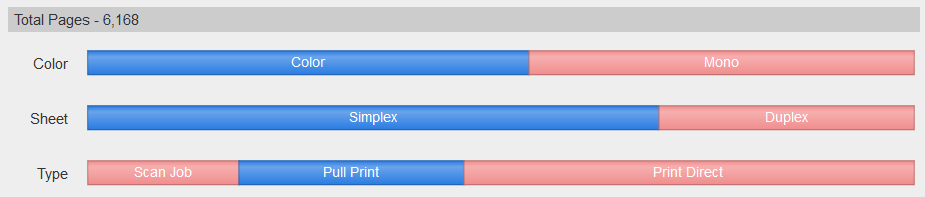
This section provides the total number of printed pages over the time period and geographical area you defined.
It also details how many pages were printed in black & white or color, in Simplex or Duplex and which type of job it corresponded to – Scan Job, Print-Direct or Pull Printing.
4. Types of Reports
TGS 10 produces the following types of reports:
4.1 User Reports ![]()
These reports allow you to view and compare printer usage for all users or a specific user.
- User Summary – displays print history of all users. You can also choose a specific user to view user’s printer usage statistics.
- User Summary by Printer – displays print history of users on the basis of printer(s) used.
- User Summary by Page size – displays print history of users on the basis of page size of print jobs.
4.2 Printer Reports ![]()
These produces reports based on printer usage.
- Printer Summary – displays print history of all printers. You can choose a specific printer to view printer usage statistics
- Printer Summary by User – displays print history of printers on the basis of its users.
- Printer Summary by Page size – displays print history of printers on the basis of size of the page.
4.3 Top Reports ![]()
Only available in Celiveo Enterprise Edition
These allow you to produce reports for the most active users, printers or departments.
- Top users – displays print history of the 10, 20 or 50 most active users.
- Top printers – displays print history of the 10, 20 or 50 most active printers.
- Top departments – displays print history of the 10, 20 or 50 most active departments.
4.4 By Month Reports ![]()
Only available in Celiveo Enterprise Edition
These reports allow you to view and compare printer usage by month.
- User by month – displays print history of all users by month. You can also choose a specific user to view user’s printer usage statistics by month.
- Printer by month – displays print history of all printers. You can choose a specific printer to view printer usage statistics.
4.5 Saving Reports ![]()
Only available in Celiveo Enterprise Edition
These reports allow you to view savings by user.
- Savings by user – displays savings realized by all users or a specific one.
5. Generating a report
5.1 To view reports
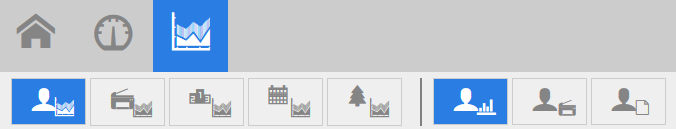
- At the [Reports] menu, click one of the categories.

- Then choose a report to view.
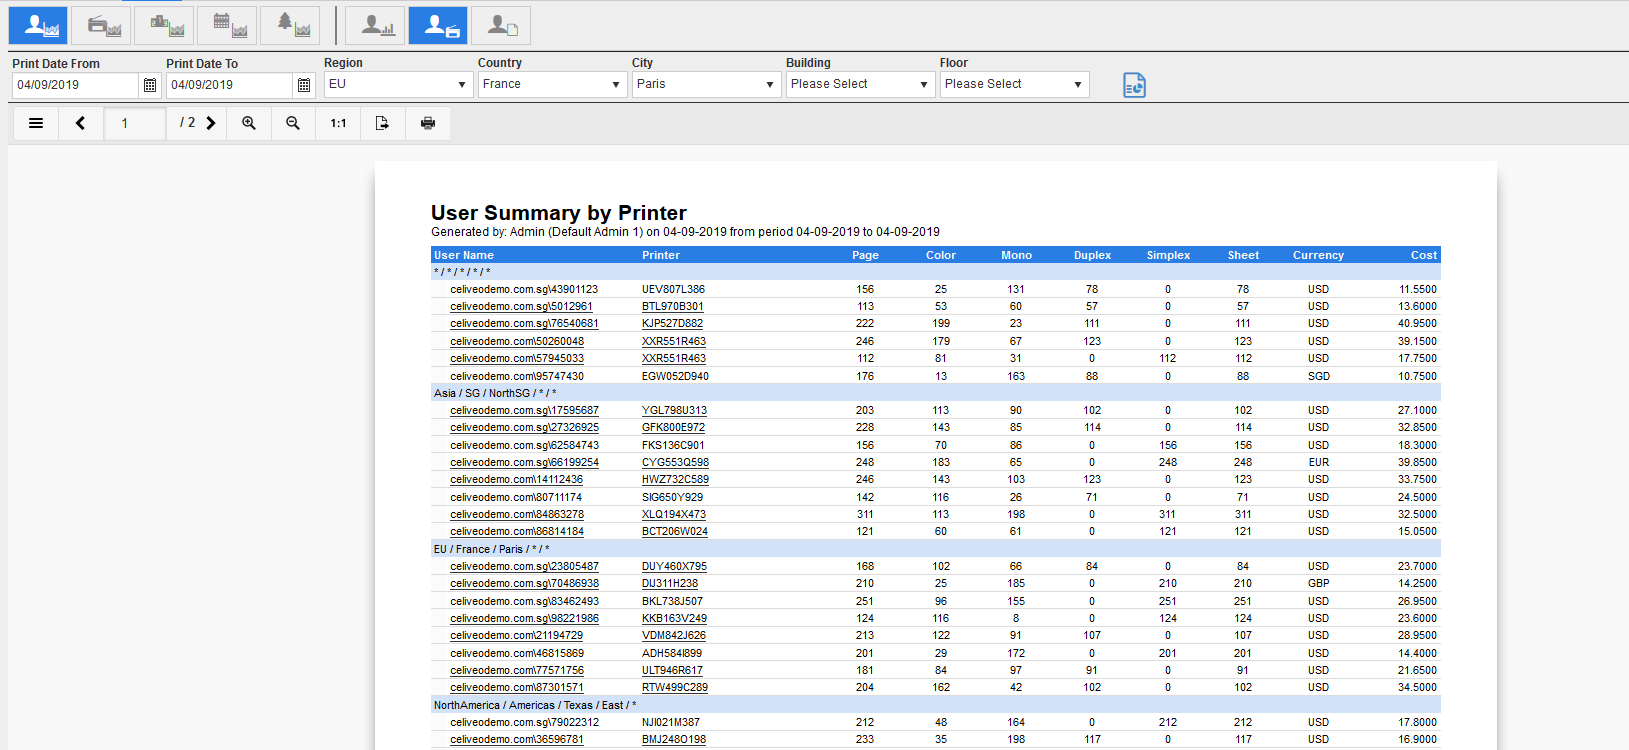
- For demonstrative purpose, lets choose User Summary by Printer
![]() .
. - Choose the dates in the [Print Date From] and [Print Date To] fields using the [Calendar] icons to specify the date range to generate the report.
- You can also choose from tags to display the records based on tag combination selected.
- Click the [Generate]
![]() icon to view the report.
icon to view the report. - The report generated will be displayed as in the image shown below:
![]()
- Click the [User Name] or [Printer Name] in the report page to view the print history of the user in detail.
5.2 Additional Viewing Options
Icon Description
![]() Click to toggle between navigation pane.
Click to toggle between navigation pane.
![]() Click to go to previous page of the report
Click to go to previous page of the report
![]() Denotes the current page number. You can also click to specify a page number to view.
Denotes the current page number. You can also click to specify a page number to view.
![]() Click to go to next page. The number denotes the total number of pages for the report.
Click to go to next page. The number denotes the total number of pages for the report.
![]() Click to zoom in
Click to zoom in
![]() Click to zoom out
Click to zoom out
![]() Displays the page in 100% resolution
Displays the page in 100% resolution
Click to export the report in any of the following formats:Adobe PDF, XHTML/CSS, Multi-Mime HTML,
![]() Excel, Word, RTF, XPS, TIFF, PNG, JPEG, Bitmap, Metafile (EMF), HTMLjQueryMobile, Powerpoint, Pinwriter (TTY),
Excel, Word, RTF, XPS, TIFF, PNG, JPEG, Bitmap, Metafile (EMF), HTMLjQueryMobile, Powerpoint, Pinwriter (TTY),
SVG, Text(CSV), Text (Layout), XML
![]() Click to print the report
Click to print the report
5.3 Schedule and Email Reports
The optimal response time to display the report is about few seconds to couple of minutes, but if the report generation takes longer due to large data set, then a prompt will be displayed to schedule report viewing for later.
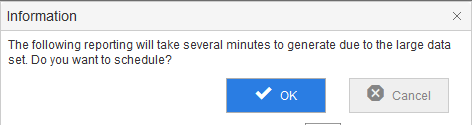
- Click [OK]. This provides an option for the report to be sent via email so that you can view it at your convenience.
- You can choose the format of the report to email, modify the filename, and email the report to more than one recipient.
![]()

Post your comment on this topic.